
To bit or not to bit?
Source code is present in pretty much everything we interact with today: phone apps, vehicle GPS, aircraft multimedia or flight controls, technological gizmos, services, video games. It’s everywhere.
And deep down, at machine level, it is indeed represented with the “0” and “1” binary form, as shown in every techno-thriller movie.
But we as developers do not spit out binary code (although I remember typing bytes long ago, to “draw” video game sprites 😊)
No, source code is written using a language, with a vocabulary to learn, and a grammar to follow. And just like the human languages we learn at school, we can end up being (more or less) fluent with a programming language.
A Rosetta Stone for developers
There are many programming languages, from the hundreds tracked by TIOBE, to the thousands listed by The Language List.
You can’t obviously learn them all, but many can be regrouped and categorized, and still represent a great variety of possible ways to make a computer do your bidding.
So, do we have to actually be fluent in each language to be able to grasp any piece of code’s meaning? Could there be some kind of Rosetta Stone, a representation to help understand code without knowledge of the language used, and even compare code from different languages?
Enter Al-Khwarizmi
Al-Khwarizmi not only pioneered algebra, but also our beloved algorithms. And this sequence of instructions is what most, if not all programming languages intend to produce.
If we look at an algorithm, regardless of the supporting language, it can be broken down into abstract elements such as statements, conditions, control flow changes, exception management.
Granted, this representation does not convey the whole code content, but it can produce a visualization of its inner logic, and assist advanced analysis functions.
Go with the flow
But enough exposition, here are some examples.
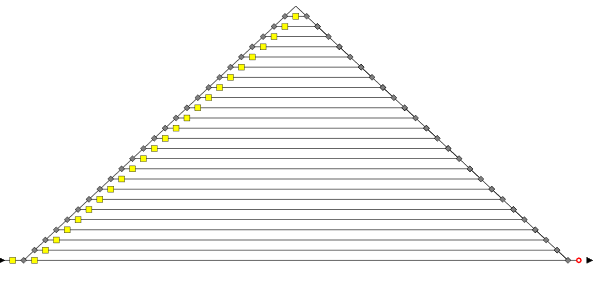
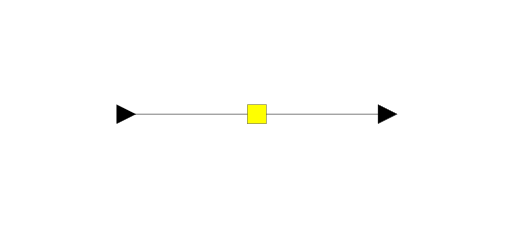 | This is just one statement. Pretty boring right? | 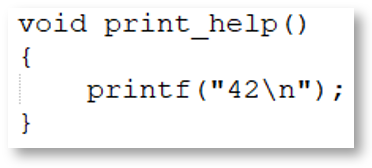 |
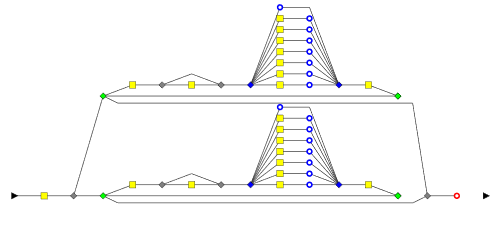
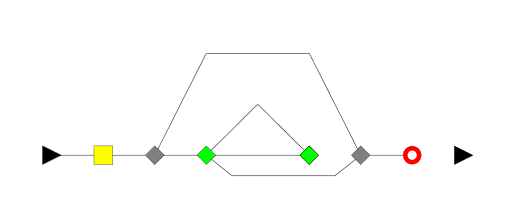 | This one is more interesting And there’s more color! | 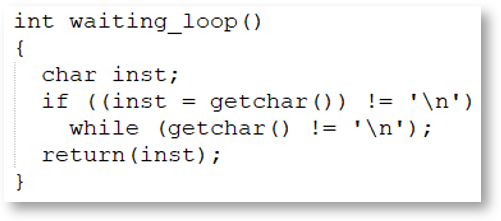 |
Now that you get the idea, let’s finish with real applications, showing you source code’s inner beauty.
 |  | Pyramids, cities out of a sci-fi movie |
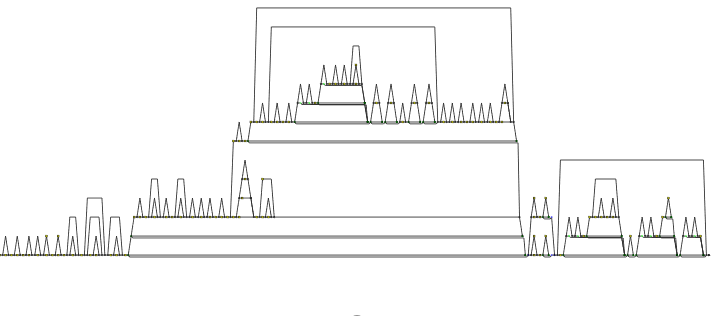 |  | 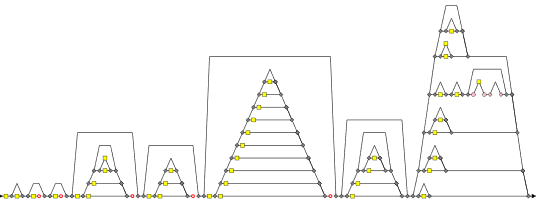 |
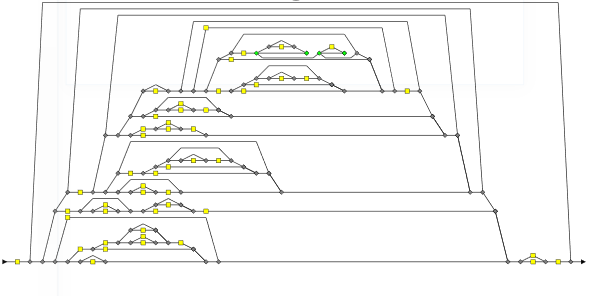
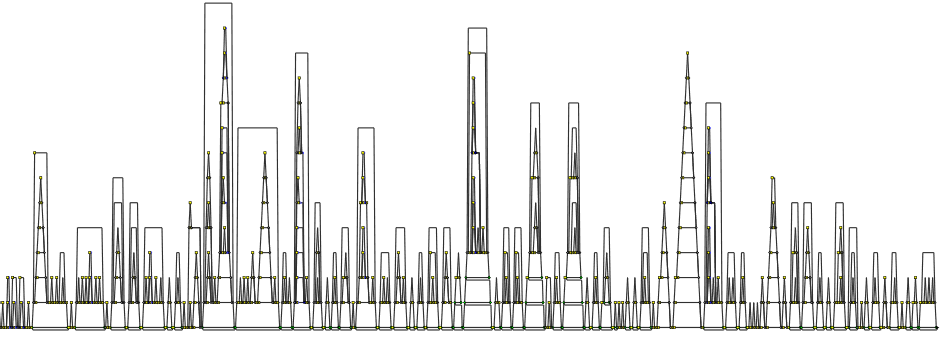
And last, a glimpse at your two favorite Operating Systems:
Flow graph of a file Manager function from Windows (3.0)
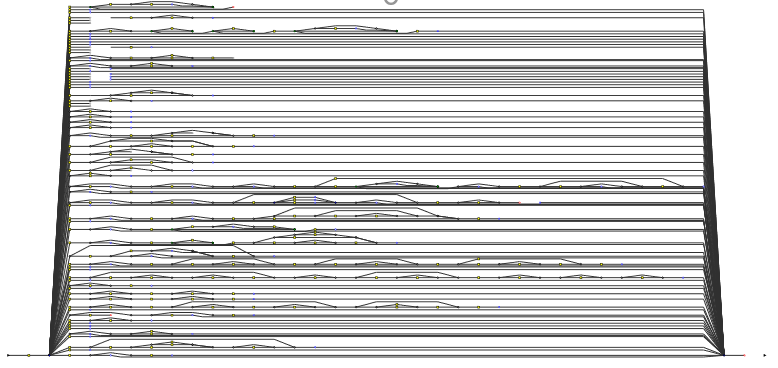
A GPU Driver function from the Linux Kernel (5.6-rc6)
Is a picture worth a thousand bytes?
These visual representations of algorithms are compelling, even mesmerizing. Some of them could be displayed in a ‘binary gallery’ (hey, that’s an idea!)
But appearances aside, there is value associated to these control flow graphs:
- Numerical data, as metrics related to the algorithm structure (depth, vocabulary frequency, nesting level, etc)
- The structure of nodes itself, which can be viewed as patterns to analyze and categorize
We will come back to these concepts soon, with interesting use cases and applications!


5 thoughts on “Anatomy of a source code”
Nice article – how did you graph the visual representations of algorithms please?
Thank you for your comment.
To generate a graph, the algorithm is first analyzed and broken down into elementary components.
This ‘algorithmic signature’ can then be translated into visual tokens.
Such tokens represent sequential statements, conditions (If, Switch, While …), control flow change (Break, Continue, Throw …), exceptions (Try, Finally, Catch …)
Thank you – I was curious whether you know of any tools for generating such flow graphs please?
(I hope that nobody had to build the Linux graph by hand!)
No, none of the presented graphs were drawn by hand 🙂
The graphs were produced by the Squore tool, which among other things embeds a code analyzer and the display features.