
Security researcher Michael Myng found the keylogging code in software drivers that were preinstalled on HP laptops to make the keyboard work. He discovered the keylogger code during the inspection of the Synaptics Touchpad software, as he attempted to figure out how to control the keyboard backlight on the HP laptop. Mr. Myng said, “The keylogger was disabled by default, but an attacker with access to the computer could have enabled it to record what a user was typing.”
According to HP, it was initially built into the Synaptics software to help debug errors. HP acknowledged that this debug software could be exploited to result in a “loss of confidentiality” but it said neither Synaptics nor HP had access to customer data due to the flaw.
As we discussed in our last post, software like the keylogging code is common practice and is initially put in place to assist developers in debugging software, referred to as ‘debug code’. As the code is shipped in the release software and a simple mechanism exists for switching it on, it presented a potential security risk. Once discovered, the debug code, due to its ability to be exploitable in the field by some malicious software, was registered as a CVE.
Leftover debug software – a recurring security risk
The unfortunate irony is that less than seven months after the original vulnerability, a similar exploit was identified in the HP Audio Driver (CVE-2017-8360). In this case, the benign debug logging code in the audio driver could also be used to track keystrokes.
Mr Myng does a detailed analysis of the issue with the most recent keylogging code here, and it’s worth a read for anyone interested in the approach and technical details related to identifying the problem.
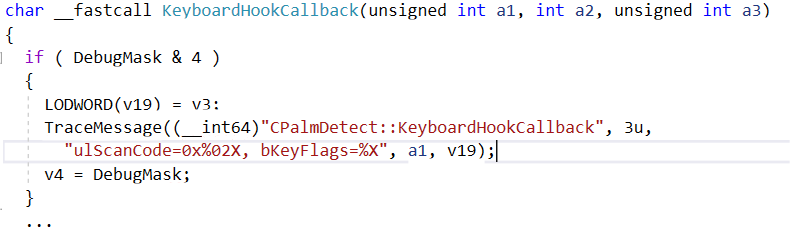
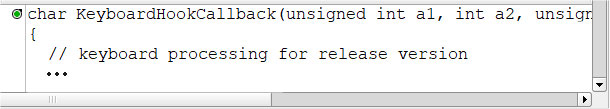
Looking at Figure 1, you will recognize typical debug code that almost every software program might use when testing or fault-finding issues.
The use of logging techniques like this is an easy way to inspect what an application is doing. We discuss various techniques like this in a prior post Illuminating System Integration. The critical issue here is that the code was left in the application after it shipped, leaving it vulnerable to someone who might want to exploit the system to steal login/password details. This brings us to the next question, is there a better and safer way to collect this debug information, without the risk of leaving potential exploits in the software after it is shipped?
Is there a better way?
One of the challenges with resolving defects in a fully integrated system is how to capture the data needed to understand the root cause of the problem. Using a debugger often changes the system’s timing to mask the bug or prevent the system from running correctly.
If we take a step back, let’s look at the concept of code coverage. Code coverage is the measure of code that has been executed, with an ideal quality goal to ensure that all lines of code are executed before shipping our software. How do we measure structural code coverage? The process is straightforward. We take the code we want to measure code coverage on, we instrument it with markers that will log some data to show us where the application has executed. Figure 2 shows an example of the original code and the instrumented code side by side.
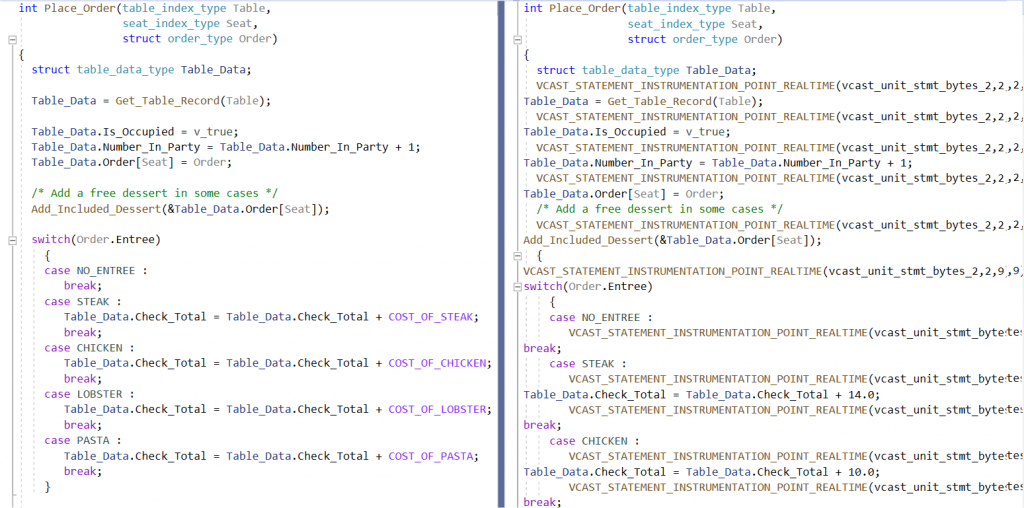
Using an Instrumenter to instrument the code for code coverage, whenever the original code is modified, we can rerun the Instrumenter and get a new version of the instrumented code. This also means, the original code NEVER needs to have any instrumentation logic inside it, as the Instrumenter can automatically recreate it. In this way, it is also NEVER possible for instrumented code to be accidentally shipped.
Debugging with Probe Points
This same approach and technology can help us implement a safer logging solution, just like what HP attempted to do. We can address this challenge using existing code instrumentation technology to make the process of adding trace code as simple as possible. There are two critical pieces we need to build a better logging solution:
- The ability to insert a block of code anywhere in our program and ensure it is syntactically correct for the region in which it is inserted
- Have the ability for the inserted logic to automatically ‘follow’ the region of code it has been inserted into so that if the code changes, we do not need to go through the manual process of moving the debug code
We can call this inserted debug code a ‘Probe Point’. An example of this is shown using a Vector tool for code analysis. In Figure 3, you can see a code editor that allows us to select the code statement to insert our trace logic.
Once we have identified where we want to insert the code, the tool (as shown in Figure 3) allows us to insert our Probe Point either above/below a statement or at entry/exit of a function.
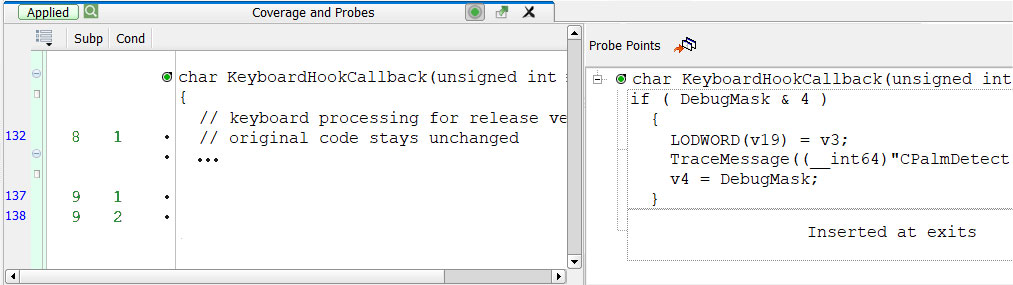
Getting back to the original issue that HP now face, the Probe Points are inserted in the same automatic way that coverage instrumentation is done. So, the original code NEVER needs to be modified with these debug hooks. Instead, any time a change is made to the software, we rerun the Instrumenter, which in this case we can call a ‘Probe Instrumenter’ and recreate the Probe Point with the appropriate debug code.
Conclusion: Using debug code with Probe Points
In this post, we have looked at what is considered a significant security flaw that can be introduced through debug code being left in product software and discussed a real example in HP Laptops. The primary issue is that the debug software was shipped in the final release and left open to possible exploitation. To avoid this, we have proposed a better approach to inserting debug software into our code. The concept of Probe Points has many advantages:
- Dynamically instruments device software to isolate defects
- Can be inserted during Unit, Integration, or System Testing
- Captures internal data values
- Can be used to record detailed control flow
- Inject Faulty Values to test error handling
- Debug hard to trigger race conditions
Most critically, the revised approach guarantees potentially exploitable debug software does NOT ship in the real application.
Further readings
- Can debug code cause security vulnerabilities?
- How SpaceX develops software
- Building the ultimate CI machine
- Convincing reasons to adopt code coverage tools
- Prevent “quality deficit” in your software
- The safe & secure software factory
- Illuminating system integration
- Technical debt in the world of Internet of Things / IoT