

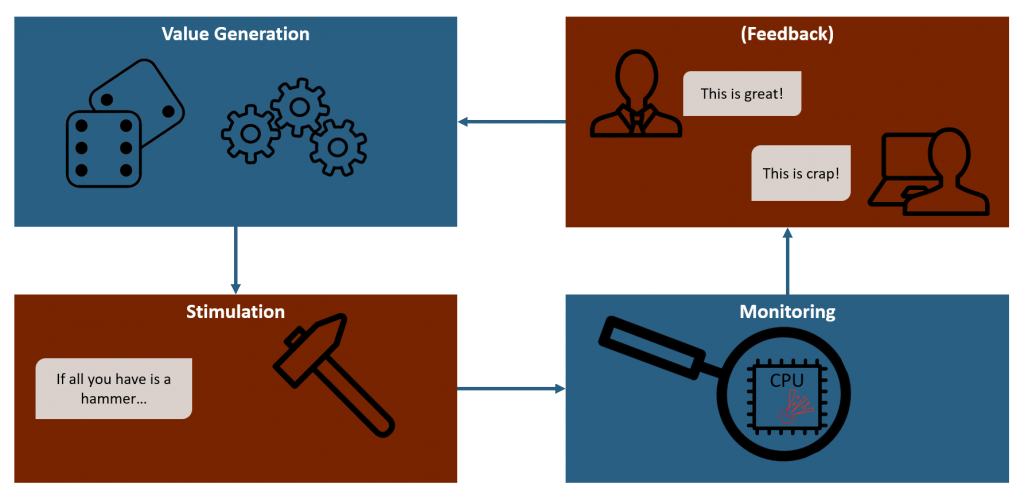
Bugs! The fuzz target is crumbling under endless waves of fuzz values sent by the ruthless fuzzers. There are monitoring options on both sides. Potential bugs are everywhere. But how to determine whether a test case actually triggered one of them? What behavior do we watch out for? And why is this such a big topic?
Setting up good monitoring of the fuzz target is a crucial step and (depending on the target) a task requiring in-depth knowledge of the target system and its domain.
I talked about monitoring in my previous posts already and promised that we will look at it in depth later.
Guess what – later is now!
Robustness test criteria: What could possibly go wrong?
We all have written (functional) tests before. We expect our code to do Y when we input X. So we write our test code to trigger the target with X and have some kind of Assert(Y).
That’s it. Simple, straightforward.
So why do I have to talk (in length!) about setting up proper test criteria for fuzzing?
The root of the issue is the vastly different (or rather the lack of explicit) expectations we have for fuzzing (or robustness testing in general).
We don’t have a very clear expectation (X => Y) as we do for functional tests.
No, we have a much more fuzzy – harrharr – expectation of: “nothing bad should happen”.
Huh. But we cannot write Assert.NothingBadHappens() right?
Indeed we cannot.
So, we really need some kind of test criteria to determine whether our fuzz test triggered some kind of behavior in the system we deem “bad”. Some behaviors are obviously bad, like an unhandled exception or crash. But beyond these obvious errors, there may be many, many more bugs, which do not result in an easily detectable crash. To detect those kind of bugs, we need target specific criteria. Thus we really need to know and understand our target.
Or we need someone who does and can tell us what would be considered “bad”.
Just imagine a space rocket control system. Those have a “safe mode” state they enter whenever something unexpected happens. This “safe mode” will blow up the rocket. So, if we can trigger a transition into “safe mode” while fuzzing , we know something bad happened.
Best do the fuzzing before enabling that self-destruction component though…
Different flavors of “bad”
Robustness criteria are ultimately system specific but let me quickly talk about common types here.
- Functional requirements
Maybe your system must meet some kind of functional requirements at all times, excluding specific circumstances. E.g. a car’s airbag activation message must never be sent on its internal network unless a crash is detected.
These types of checks are very useful. They cover the central requirements to your system and you should check them in other tests as well. This means that you may be able to re-use existing monitoring and check the infrastructure for fuzzing. - Non-Functional requirements
Similar to functional requirements, these are crucial to your system’s correct behavior. Typical examples of such a requirement is a bounded response time to a request. Another one is guaranteed availability (e.g. software must never crash). - State Machines
If the system uses some kind of state machine, observing the transition during testing can be useful to detect invalid transitions or transitions into error states. - Hardware
If you have only limited monitoring options about the software, maybe you can instead observe the hardware. Measuring power consumption can yield information as would measuring response time or even core temperatures.
These typically only provide a coarse-grained view, but are useful to detect things like infinity loops, reboots or a crashed process.
Monitoring: Perform a full sensor sweep!
Knowing what flavor of bad we want to watch out for is the first part of the equation. But we also have to think about how to actually get that information. Which – again – depends a lot on the type of target.
Is it a pure software target we have full control over (see discussion in my previous post)?
That is great, we can let it run in debug mode and observe its execution, set (conditional) breakpoints, view memory or insert Assert(Y). We can also use sophisticated compiler options to instrument our code in a special way as I will delve into further down this post.
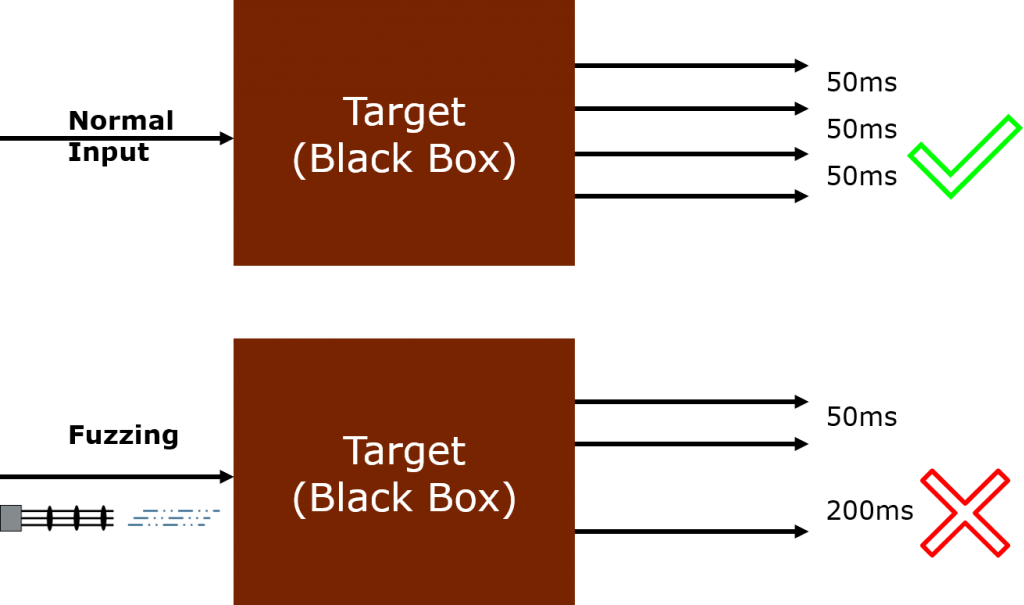
But what about a cyber physical (embedded) system? Maybe one where you actually don’t have much control or even knowledge of the source code. In such a case, monitoring becomes a real challenge and we need to get creative.
We cannot simply introduce a few lines of code to measure the system’s response time.
Instead we would have to observe the external interface of the target and note down when it replies to a request. This obviously adds a lot of intermediate delays (networking, OS, buffering, scheduling, etc.) and screws up our measurement.
We also have to actually be able to monitor the respective interface. This may very well require specialized hardware and software – plus the knowledge how to use those.
Instrumentation – Help us, compiler. You’re our only hope!
Let us focus on the cool and powerful things first, before we address the nasty ones, right?
So for now, let us assume we have a bog-standard software target. Maybe some kind of library providing a public API to be used by other software to provide some kind of service. We have its source code available and managed to set up a working build environment.
In short: we have a working development environment and can introduce changes to the code as necessary. Great.
But let me rewind a bit.
To build your code, you have a compiler.
A piece of marvelous software taking in the (more or less) human readable text files with source code in it and produces machine code for our hardware to understand. This transformation is some serious dark side voodoo necromancy to the vast majority of us and we simply accept it as a given.
But compilers can be tweaked, configured and tasked in many ways to influence the final output in a substantial way.
An example we all know is the “Debug” vs “Release” configuration switch. Among other things, this switch will tell the compiler to tone down its code optimization for debugging or dial it to 11 for the release version.
Compilers have been worked and tweaked on to output ever more optimized machine code for decades. In addition to optimizations, other use-cases have been discovered and subsequently been added to (some) compiler.
One of those use-cases can be summarized by the term instrumentation.
Instrumentation core principle – Adding non-functional instruction during compilation
At its core, instrumentation is a process where the compiler automatically adds additional instructions a given code.
These added instruction are non-functional in the sense that they achieve certain goals which are not part of the user code.
Let me rephrase this again: the compiler adds instruction to our code we have never written.
Creepy? A little.
Powerful? Heck yeah!
Many different types of instrumentation are known and vary greatly between programming languages and compilers.
In the context of monitoring and fuzzing in particular, we are especially interested in a certain sub-type: Sanitizers.
(No, not the kind you use for your hands frequently during a global pandemic.)
Let us jump right into the topic and look at a some of them and why they are such powerful monitoring tools.
Memory sanitizer – Keep your workplace in order and clean up when you’re done!
Still one of the most common and most devastating bugs are memory management errors like buffer overflows, out-of-bounds accessing or use-after-free. They are common to C/C++ and other languages with an unmanaged memory concept. To make matters worse, these languages are commonly used for low-level, performance critical systems. Like operation systems or some cyber-physical devices controlling the fuel pipelines of entire nations…
Manually testing for this kind of errors is hard – which is why they are so common after all.
And why there are still so many successful attacks, especially against highly critical systems.
Why should testing for this kind of bugs be harder than for others?
First off all, it is hard because these kind of errors do not necessarily result in a crash. You can have a buffer overflow in your code and not notice it at all.
It depends on the individual layout of the memory at the moment the error occurs. If there is another buffer or value of your program located at the overflowing memory location, the program will not crash. And we will not spot the error.
This is bad news.
And here is where instrumentation enters the stage.
Wouldn’t it be nice if we can simply tell the compiler that the code should rather crash on some kind of memory errors?
As it happens, we actually can. By simply adding a compile flag!
I am of course talking about AddressSanitizer of LLVM (a feature ported to some other compilers as well). You just have to add -fsanitize=address to your clang build and link command.
Et voila, the compiler will auto-magically add instrumentation to your code, allowing runtime detection of various memory management errors. Now the program will reliably crash in case of a memory handling bug!
Other types of sanitizers & fuzzing
There are various other kind of sanitizers out there. Most of them work in a very similar way to AddressSanitizer.
That is they add some clever instrumentation instructions to detect errors at runtime and crash the program.
They check for things like undefined behavior, threat safety, race conditions, memory leaks or stack safety.
Another kind of instrumentation is able to provide benchmarks such as execution time, memory footprint or code coverage.
We will look at those in the next article, as they are fundamental for feedback driven fuzzing techniques.
When we do fuzzing, or indeed any kind of testing, we want as many of these sanitizers active as possible.
Why?
Because they greatly expand the amount of errors we can (automatically) detect.
Instrumentation downsides – Great power gained at great cost
As noted above, instrumentation adds non-functional instructions to the generated machine code.
This obviously means that we pay a performance cost for having instrumentation. In terms of (program) memory and speed both.
I can already hear you ask: “How much though”?
As usual, the answer is: it depends.
The performance impacts vary greatly between the different sanitizers.
AddressSanitizer roughly doubles the runtime of a program.
SafeStack on the other hand has a nearly immeasurable overhead (around 0.1%).
While ThreadSanitizer introduces a performance overhead of 5 to 15 times compared to the original.
Non-pure software targets – theoretical, practical
Theoretical: all those sanitizers and instrumentation are awesome and will greatly aid our (fuzz) testing goals.
Practical: in the case we can use them. There are many cases were we might not be able to.
- Lack of source code: if we do not have the source code or cannot build it for whatever reason, we cannot use (most) kinds of instrumentation. There are some binary instrumentation available, but these are in general less powerful.
- Cyber-Physical System: These kinds of systems have a number of difficulties with regard to instrumentation.
- They often run on “uncommon” hardware. Ones with much less compiler (and thus instrumentation) support compared to the mainstream platforms such as x86 or ARM.
- Divergent behavior. Things which work fine on your development system may not work on the target system. Or simply work differently. Well-known issues include naughty old Endianness, interrupt handling and error behavior. So we cannot simply do instrumented testing on our development system and deem the results (generally) applicable to the target.
- Resource constraints. Many embedded systems are greatly constraint in the amount of processing power and memory. The constraints may be hard enough to make the use of (some) instrumentation on the target hardware impossible.
Practical: we need other ways to monitor the target.
I/O-based monitoring – Well meaning voyeurism
Okay, if we cannot make the software tell us what it is up to… we are back at the drawing board.
This means, we are in a black-box scenario right?
We send test data to our target, it processes it and then outputs something.
Probably. Hopefully.
Hm.
So what can we do in such a case with respect to monitoring?
Well, we must solely rely on the output of the system.
Which of course wildly varies between targets. It may be console output, some LEDs blinking, network packages, file changes or even something like controlling actuators.
From these, let us pick networking to look a bit closer into.
Passive network monitoring – I see what you did there
Observing the packages or messages sent by the target over its network connection can provide a good approach point for black-box monitoring. First of all, we can simply check whether it actually is communicating over the network interfaces connected to it.
If it does not … well, then it may simply be in some kind of sleep state and needs to be woken up by some kind of trigger.
You could throw all kinds of fuzzing data at it, and it will not even look at them. We don’t want that, right?
So it is important for the target to be in a working state to begin with – but I digress.
What can we learn from monitoring the (outgoing) traffic of the target?
- Determine whether the target is still alive. If our fuzzy death beam hit something critical and the target kernel panicked and shut down, we can notice a sudden lack of regularly sent messages. Assuming the target did send some kind of regular messages of course. But most systems do. Say, a heartbeat or TCP Keep-Alive message.
- Notice restarts of the system or sub-services. Typically, a target will send a certain sequence of messages as part of its boot-up phase. It may establish a TCP connection or perform a TLS handshake and it most likely send ARP requests. Watching out for such messages or sequences during testing, we should be able to detect restarts.
- Alert messages. Some systems and protocols will send alert or error messages if an error happens. While fuzzing, we will see lots of them. But it can be interesting to note down which kind of error messages we get back. Is it always the same one. Or is it changing between different test cases? In the latter case, we can use this as a (very) crude kind of feedback to steer the fuzzer.
Active network probing – You still there mate?
We can certainly get a more active with our fuzz monitoring and try to query and probe the target for information about its current well-being. Like your five-year old asking you every other minute how long until you reach Disneyland.
This does depend even more on the capabilities of the target compared to the passive approach of course.
Multi-stage handshake protocols are supported by most systems. These can easily be used for active probing.
Like TCP or even a simple ICMP Echo (the good old “Ping”).
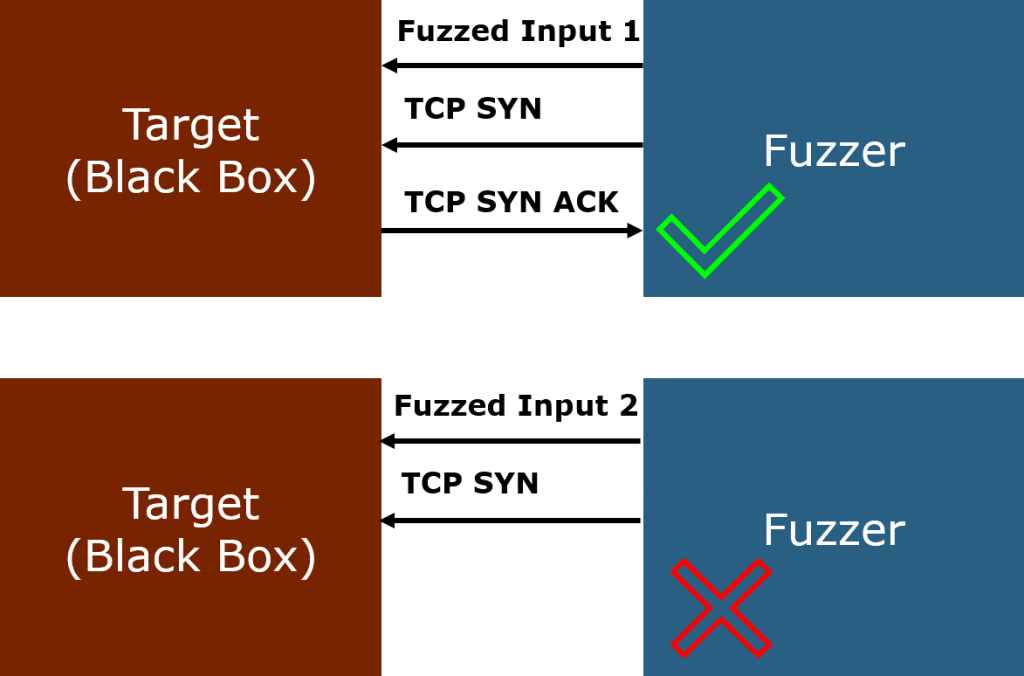
If you have found a useful probing mechanism, you would just probe the system after each sent fuzz frame.
Does the target still respond as expected? Great!
Does it not respond or take very long to do so? Well, we might have hit something interesting then. Better mark the test case for reproduction.
Debugging Interfaces – Tell me all about yourself!
Most devices will have some kind of debugging capabilities (someone once did develop this thing after all!) and maybe they forgot (or actively decided) to let them enabled. Which, by the way, is a pretty dangerous idea from a security point of view.
If you manage to get debug access of information from the fuzzing target, you can elevate this for your monitoring needs. How effective it turns out depends entirely on the target of course.
At the lower end of things, you may be able to read out things like logs, some status information (CPU load, memory usage, core temperature, etc.) or error codes – which is already pretty good for our monitoring goals. On the upper end, you have things like full JTAG access, providing full-blown hardware debugging. At which point you have next to full control over the system.
I will not go into much more detail on this and will just let the above remark here. Remember it as a situational option. One that might be pretty powerful too, but too situational to dig deeper in this more generalist post. You will also likely need someone with in-depth knowledge of the system to make the best use of this kind of monitoring.
Intruder Detection System (IDS) – “Red Alert. Red Alert!”
IDS can be viewed as a vastly extended version of the passive (network) monitoring noted before. It has build-in “knowledge” of what is “good” and “bad” traffic. Depending on the target in question, we might well be able to use this in-build knowledge as a source of monitoring.
The approach is particularly interesting to detect follow-up errors triggered by fuzzing. Let us do a quick example setup to look at this.
IDS example setup – You’re not supposed to do that.
So, imagine we have our target and an IDS observing the output of the target. Not the input of course, since Fuzzing will most likely trigger any IDS worth its name.
Now we start up the fuzzing and bombard the target as usual, while keeping the output under IDS inspection.
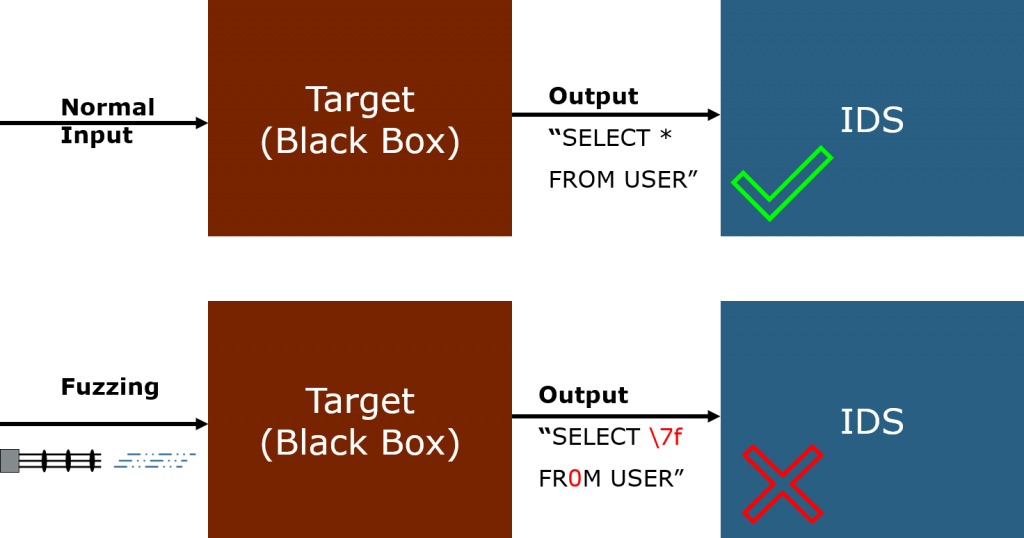
Why though?
It is pretty simple: if we can trigger the IDS observing the target’s output, we managed to (somehow) influence the target into doing something the IDS deems suspicious.
Let us take a step back and recall were we started. Our naive robustness test criteria was: “nothing bad happens”.
Well, if an IDS observing the target’s output triggers, we know something happened the IDS deems “bad”.
Which is exactly what we want to find with fuzzing!
IDS and AI – Playing the buzzword bingo game
Everyone and their relatives is throwing AI “solutions” at their problems and tasks nowadays, hoping that it will magically solve all the things.
In the case of IDS, this might work out pretty well if the systems to be observed are consistent enough for an AI to learn.
Trying to learn the internet usage of a public hotspot or internet cafe isn’t likely to be very successful for example. The clients are just too diverse, the requested homepages and services to different and inconsistent.
But a closed network of machine-to-machine communication, like the back end of a cloud infrastructure or an IoT network?
That might work out reasonably well indeed.
For our use-case, it actually matters little.
If we have an IDS for our target output, we do not really care what kind of IDS it is and how it was created, right?
Whether it was hand-written in some obscure scripting language or distilled from a neural network doesn’t change the way we use it to monitor for fuzzing “successes”.
Bottom line – tl:dr
Alright, this was another lengthy one (again).
Let me summarize this post on monitoring the fuzzing target in a few quick take away bullet points:
- Robustness criteria are required to detect errors triggered by Fuzzing
- Monitoring the target is required to notice robustness criteria violations
- Monitoring is inherently target specific and may require in-depth knowledge of the target
- Software monitoring via code instrumentation and sanitizers is preferable where possible
- Network monitoring and IDS can work in a black-box scenario


2 thoughts on “Monitoring the fuzz target – Revenge of the Bug”
Hello, I think your article is very helpful to me. I am currently studying the fuzzer of the ike protocol, but I don’t know how to monitor it. Does the host detection (ICMP echo) also apply to ike? Do you know?
Hi John,
glad you liked it!
As for IKE & ICMP… it would depend on the configuration of the system, but would certainly be worth a shot.
IKE is implemented atop UDP, which in turn is atop IP, while ICMP is just based on IP.
This means, a system running IKE may also run ICMP but not necessarily so.
Furthermore, some systems actively block incoming ICMP messages, especially “Ping”, via a firewall or routing tables.
So, to wrap it up: just try your target system. Open a console and ping away at your target’s IP address.