
Imagine you are developing the software of a complex cyber-physical system, e.g. laboratory automation system, industrial robot, etc.
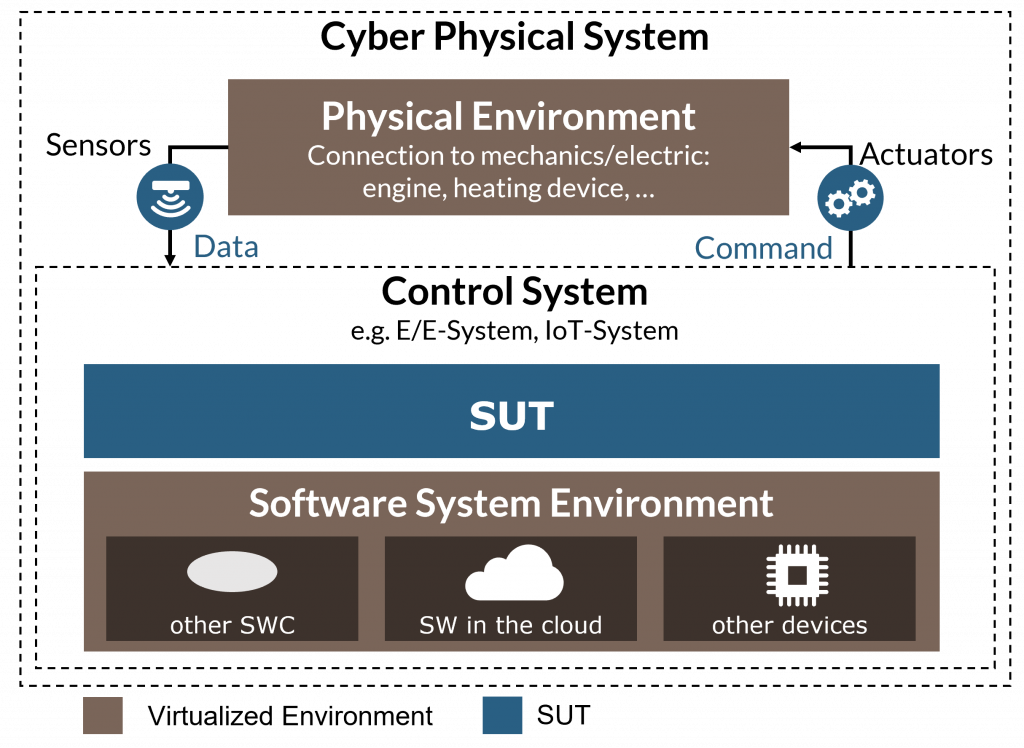
To manage complexity, you might develop the software in a virtual environment, wherein the physical and software system environment are simulated.
But what if your system-under-test (SUT) does not react to the inputs of your simulated environment as expected or some system-level tests fail?
This is where debugging comes into play:
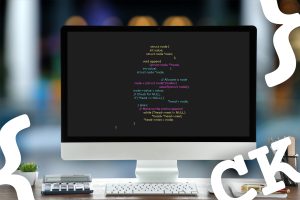
You need to debug your software on system level in your virtual environment. But this can be quite tricky, as you now have to debug a composite system, which consists of your SUT and its simulated environment.
Example: Debugging software for a temperature controller
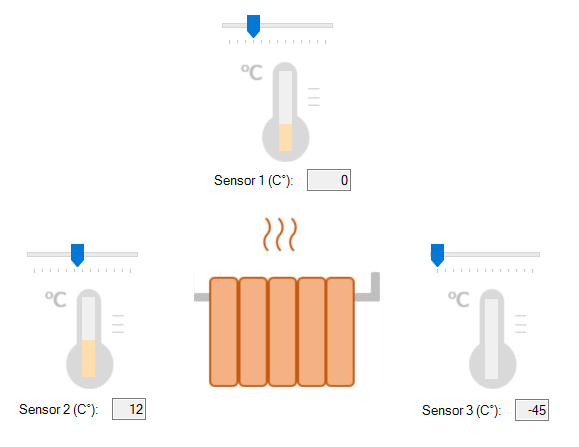
You are developing the software for a temperature controller that switches on a heater depending on the ambient temperature. The ambient temperature is measured with three temperature sensors. The required behavior of the controller software is to turn the heater on when the average temperature of the system drops below 18°C.
To develop the controller software in a virtual environment, you simulate the three temperature sensors with a simulation tool. The tool provides the three temperature values and consumes the resulting heating state of the controller software. This allows you to visualize the time evolution of the heating state depending on the temperature values and to observe if your controller software reacts to its environment in the required way. It also allows you to conduct automated tests of the controller software without the actual controller hardware.
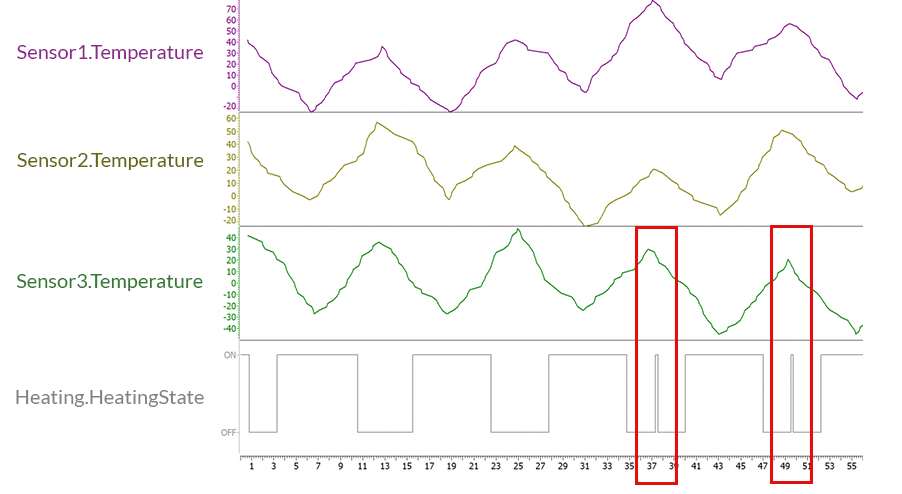
The upper figure shows that the heater turns on when the three temperature values are low, and turned off when the values are high. This corresponds to the required behavior. But, at second 37 and 49, the temperature values are high and the heater suddenly turns on, which is not the required behavior. This is obviously a bug in the controller software, which you need to find. Take a look at the function ControlTemperature in the controller software which is responsible for switching the heating state:
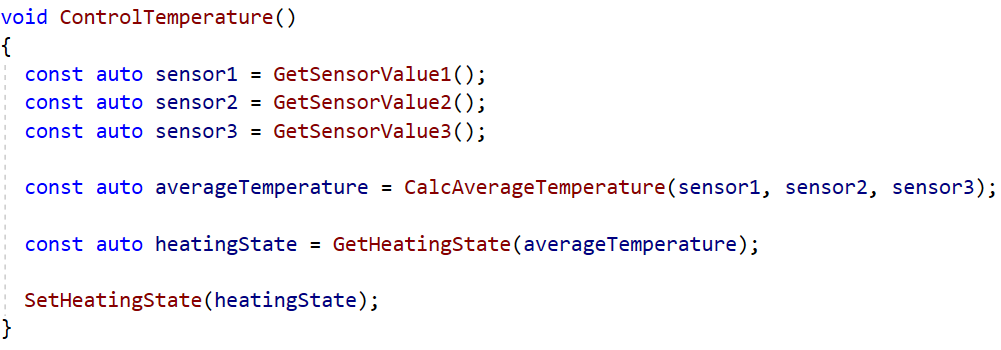
The function reads the three temperature sensor values from the simulation tool and calculates the average temperature. Based on the average temperature, it decides if heating is required and afterwards sends the updated heating state back to the simulation tool.
In order to find the root of the undesired behavior, you need to debug the controller software together with its simulated environment.
Problems when debugging software in virtual environments
Logical divergence of SUT and simulation environment
You could set a breakpoint in the controller software, step through it, and examine what happens during execution. But your environment simulation keeps running and does not wait for your controller software, which is in debug mode. Consequently, the simulation and your controller software will soon no longer operate on the same time base. Thus, it would be beneficial to couple the execution of the debugger and your simulation environment. In consequence, you avoid logical divergence of your SUT and the environment.
Visualizing and monitoring debug data over time
Another problem in this context is the visualization of critical quantities. The simulation tool visualizes and monitors input (sensor values) and output (heating state) values of your SUT. However, to analyze the internal variables of your SUT during the simulation you use the watch window of your IDE. It is difficult to successfully analyze external (input/output) and internal quantities simultaneously with a common timeline in two different tools. If you had the input/output values and the internal variables of your SUT next to each other, it would be easy to see correlations between unexpected changes of output values and suspicious changes of internal variables.
Debugging the temperature controller software
Applying the above findings to the temperature controller example, the visualization of the internal stack-variable averageTemperature next to the heating state in the simulation tool reveals a bug with the averageTemperature:
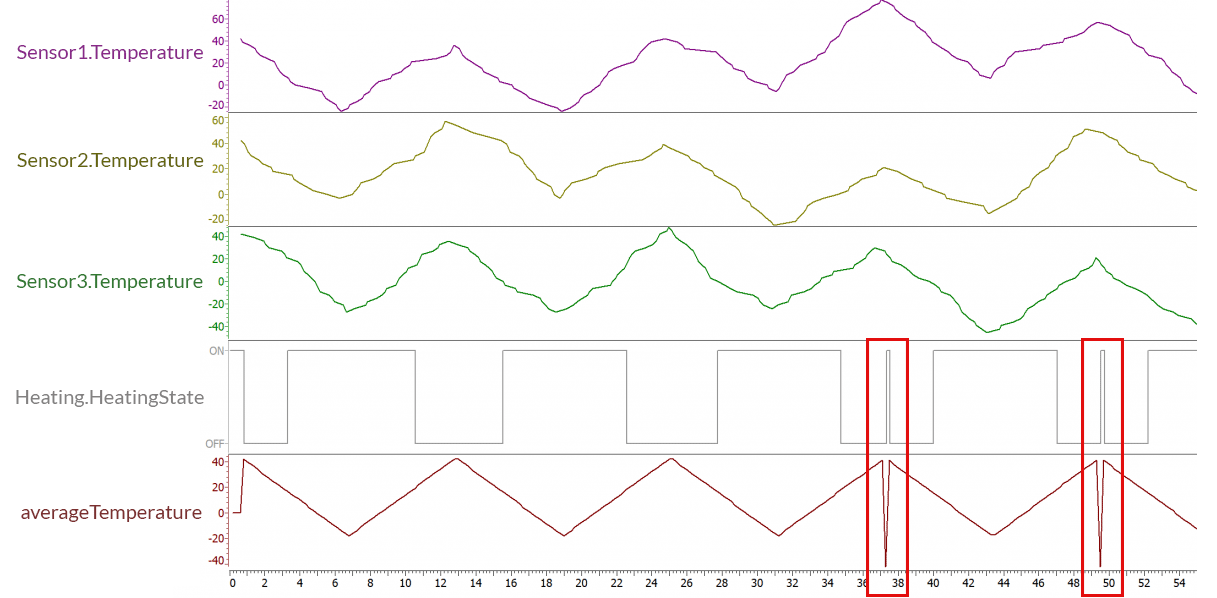
What you can see immediately: The unexpected change in the heating state is related to a sudden jump of the averageTemperature variable to negative values. This indicates that the bug can be found in the CalcAverageTemperature function.
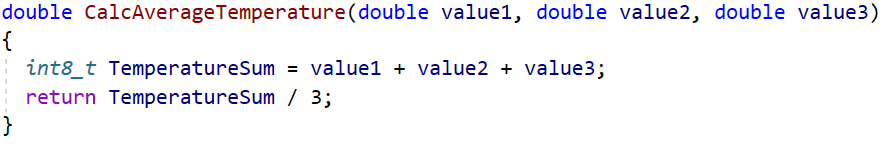
It turns out that the wrong data type (int8_t) was chosen for the variable TemperatureSum, which led to an overflow at sufficiently high temperatures.
Conclusions
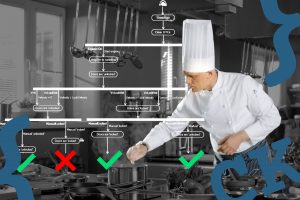
In this example, you could see the advantage of coupling the debugger with the virtual environment. Then you get a deeper insight into the time evolution of the SUT. It is very helpful to visualize internal debug expressions in the simulation tool. You can easily explore hidden correlations between external behavior and internal quantities. Ultimately, this enables a combination of black-box testing with white-box analysis at a system level.
Video HowTo: Software debugging in a virtual environment
Check out our video tutorial for the actual implementation of those debugging features with CANoe/CANoe4SW as simulation and virtual test environment.
Get started with your projects
- Know-how: System testing in virtual environments
- Product information: Develop and Test Software of Distributed Systems with CANoe4SW