What is it?
Chart.js is part of the Front End development family.
This popular JavaScript library makes data visualization work much easier and has been evolving since 2013. With over 800 companies reportedly using Chart.js, more than 11k forks, and 54k stars on GitHub, this is a great example of an active open source community.
We include Chart.js systematically in our software quality monitoring of GitHub projects.
Important note: If you notice that the project’s latest versions are not visible in our monitoring, it’s normal. We regularly update our base, but not continuously, to leave time for the code to properly evolve.
So come back regularly, as new versions are added to our monitoring, and trigger new analyses.
Big picture – overall view on software quality in Chart.js
Project size
Chart.js is mainly a JavaScript project, with some TypeScript code appearing in version 3.0.0.
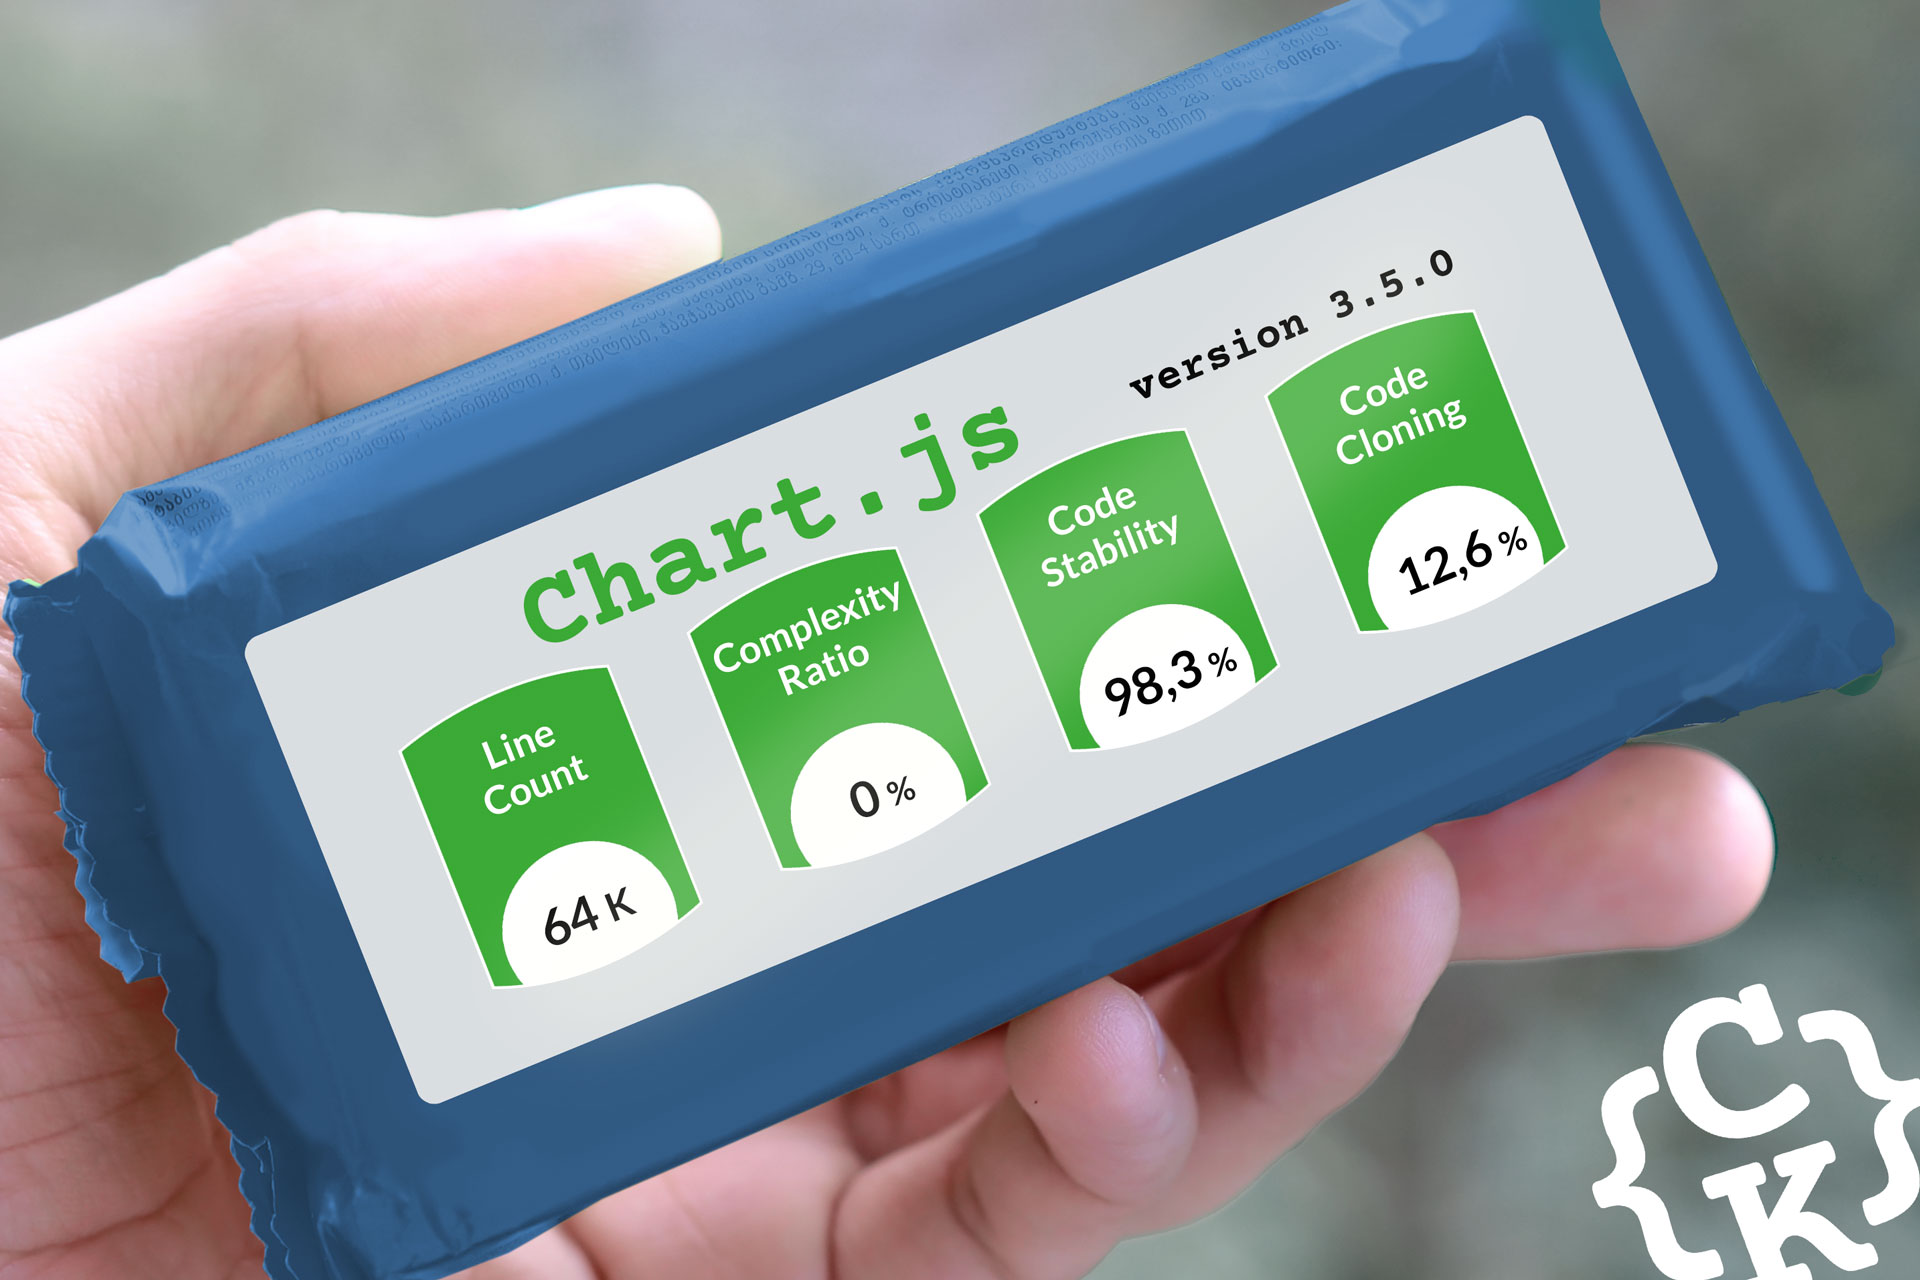
The analyzed version (3.5.0) counts :
- over 64k lines of code (about 46k of which are effective code)
- 606 files
- 2457 functions
Chart.js – Project complexity
- This project has a very low complexity ratio
Since version 3.0.0, the functions considered as complex have been less and less, dropping from a mere 1% to 0% of the code volume in version 3.5.0. That is an indication of good control over code complexity, that usually grows, especially in old applications. - The most complex function is 117 lines long, and has been flagged because of some complexity metrics checked above the thresholds. But all in all, the code is not overly complex, as shown by its very clear control flow graph:
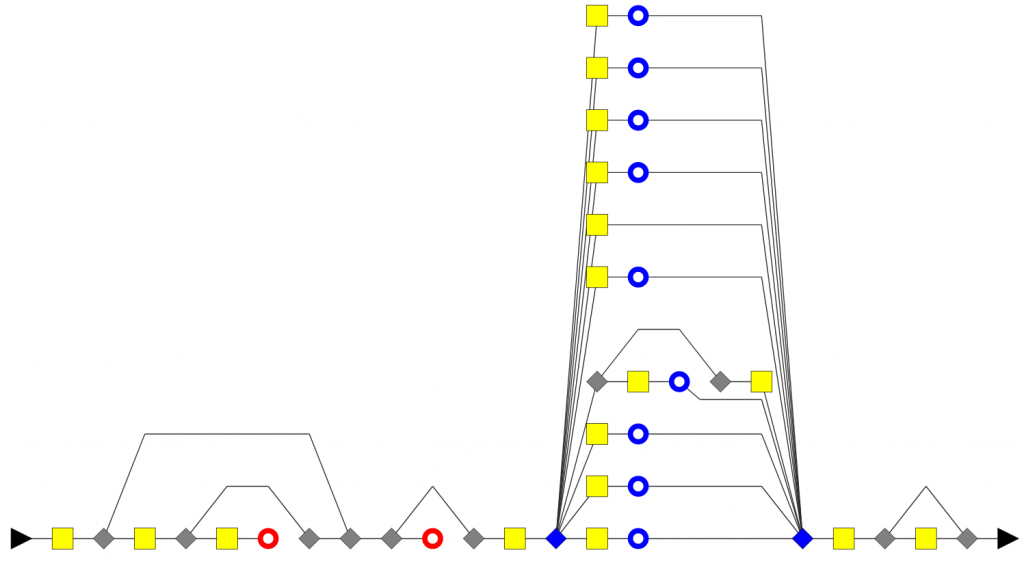
Chart.js – Technical debt
- The overall Technical Debt is over 26 days
- The “New Technical Debt” (for added code) is 5h1′
- The “Modified Technical Debt” (for modified code) is 2 days and 5h
- The “Unchanged Technical Debt” (for unmodified code) is 23 days
More about measuring and monitoring technical debt
Software quality analysis: Why did we focus on Chart.js?
The project trend indicators (Code Activity, Technical Debt), each slightly changed one way or another (less than 5% variation), and the Complexity Ratio is stable. This project which was added in 2013 in GitHub is a good example of long term evolutions, as we have retrieved code and applied a quality rating model on 5 years of development (14 versions counting major and minor releases), from v2.2.0 (July 2016) to v3.5.0 (June 2021).
Analyzing the different quality indicators produced by the rating, it is clear that there has been a decisive change in version 3.0.0. Let’s see this in more details.
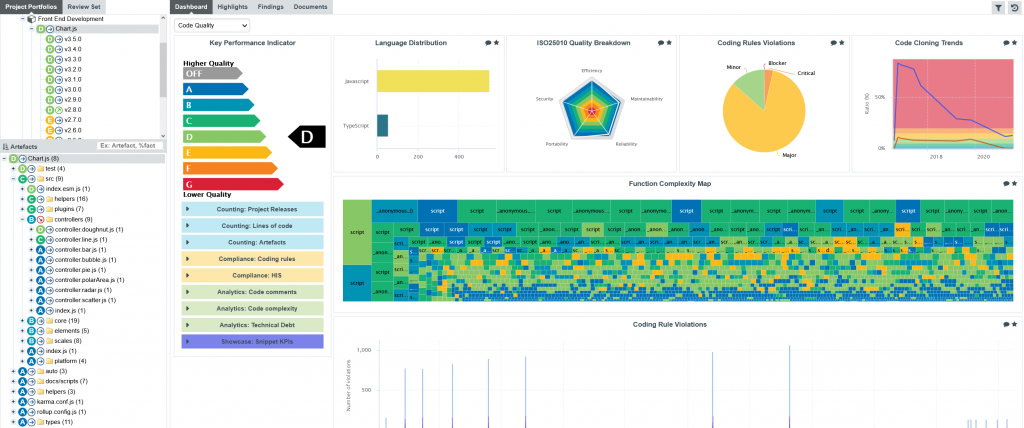
Exploring the dashboard
Let’s open the Code Quality dashboard for Chart.js version 3.5.0.
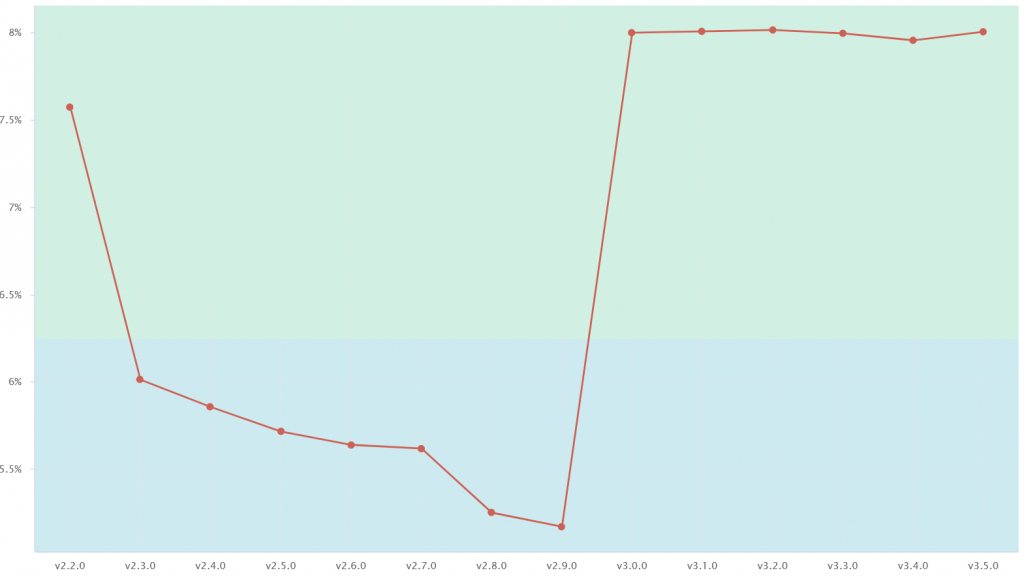
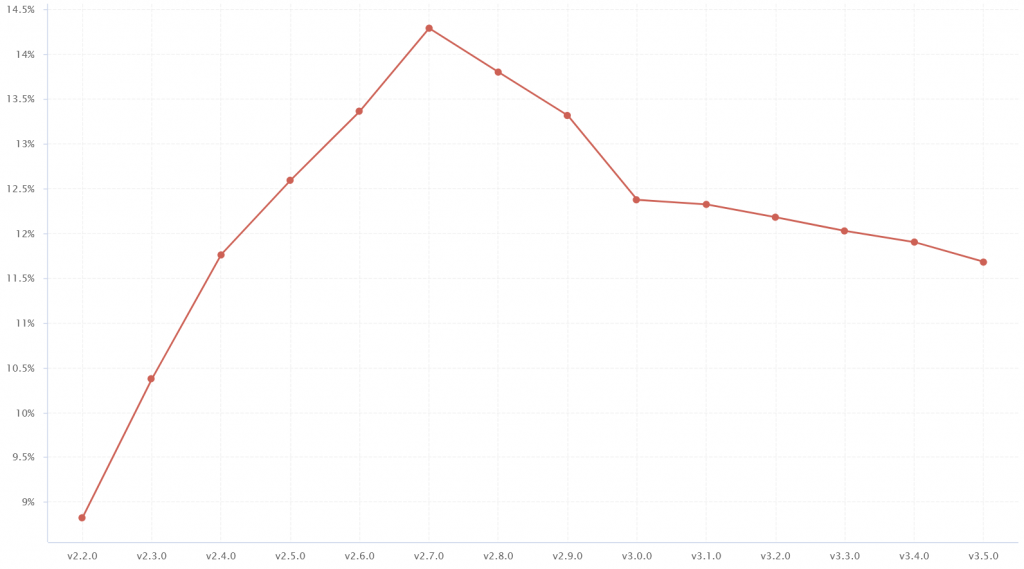
- Looking at the ratio of complex functions, we can see a decrease from version 2.2.0 (7.6%) to 2.9.0 (5.2%)
As usual with this kind of chart, we must be mindful of the vertical scale range. The complexity ratio stays between 5% and 8%, which already shows that this project complexity is not overly high.
We can still see a sudden change in version 3.0.0, where the complexity raises up to 8%, reaching the levels of version 2.2.0, five years earlier.
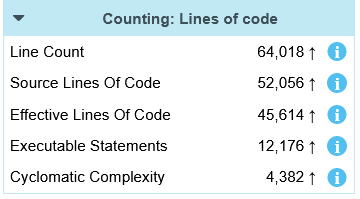
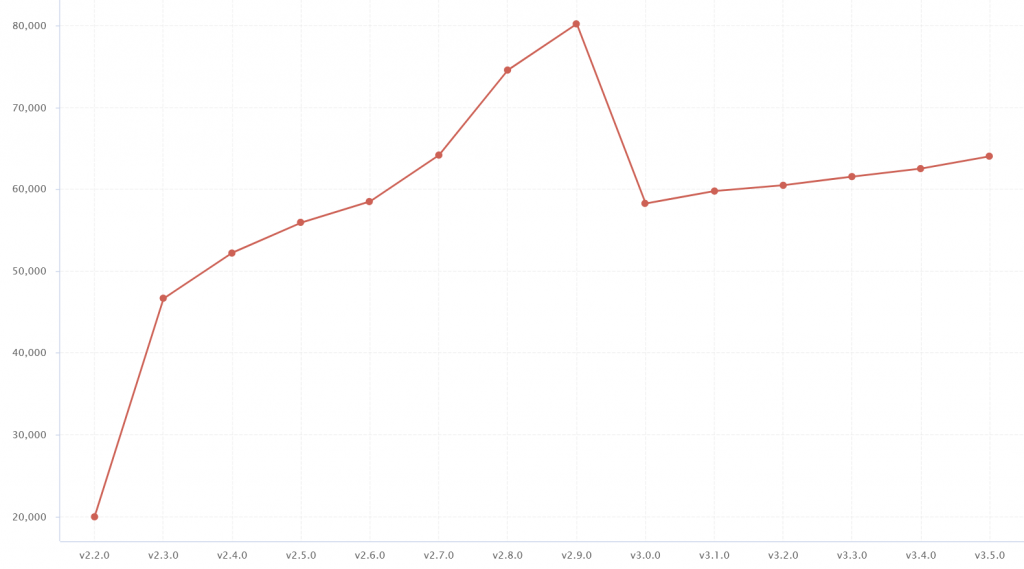
Continuing the analysis, let’s look at the code volume. In version 3.5.0, there are 45614 lines of effective code, which is ignoring comments and simple delimiter lines.
And if we now focus on the actual code trend since version 2.2.0, we can notice something interesting: the number of lines between versions 2.2.0 and 3.0 0 almost tripled (from 20 006 to 58 247), and yet the ratio of complex functions we checked earlier evolved from 7.6% to 8%.
A much higher raise of complexity could have been anticipated, but here the increase is negligible, and suggests that the development has been done with complexity control in mind.
Exploring the comment rate
In software quality, one of the keys of good maintainability is how easy it is to understand the source code when a fix or an enhancement has to be applied.
Looking at the comment rate ratio we can clearly see that once again, despite the great increase of source code volume, functions are still being consistently commented.
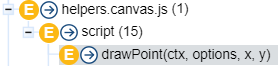
- Looking for comments in complex functions
If we push the analysis by filtering out the most complex functions, we end up with the “drawPoint(ctx, options, x, y)” function, mainly a “switch” clause.
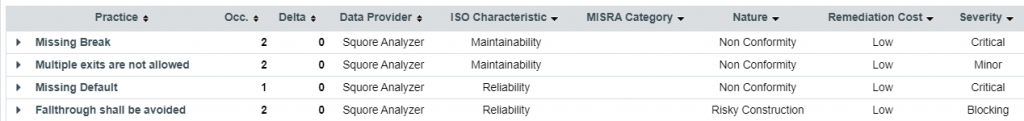
It not only contains comments where it is necessary, but it also justifies that some “fall through” in this “switch” are intentional. - Handling justifications
Still focusing on the “drawPoint(ctx, options, x, y)” function, let’s integrate the justifications we found into the rating.- Initially, the global rating for this function is “E”, mainly because of two “Blocking” rule violations found in the code.
- If we justify these two “Fall through” violations, then the rating is updated for the function, and impacts its containers and their standard rule compliance.
Healthy development and quality tracking
This brief exploration of the software quality analysis for Chart.js has shown this code has evolved in a healthy way, with controlled complexity and comments. It also showed how the rating analysis, and in particular the standard rule compliance can not only detect where findings should be handled, and also justify them whenever necessary, providing an accurate and trusted vision of the project quality.