
Why would you need to filter relevant source code violations? Aren’t all code violations important? And what does “relevant” mean anyway?
Speaking of good quality habits, violating a coding rule is obviously not a good practice. But when a code checker reveals tens of thousands of rule violation occurrences, you just need an efficient way to expose the ones you are ready to fix or review.
One of the problems found when dealing with a large amount of data is finding the best visuals and the best interactions to be useful and usable. This problem gets worse when the amount differs from one situation to another, in various orders of magnitude.
We faced this situation with the tool Squore, particularly in the case of the “Findings” feature. When you import a project into Squore, several analyzers detect violations of standards and good practices on the source code a requirement, a test, or a ticket. Each violation represents a finding. For instance, when the Checkstyle analyzer detects the violation of the “LineLengthCheck” rule, at the line 128 if the base.c file, Squore creates a finding.
This article presents a solution to visually represent a large amount of data, from a few tens to hundreds of thousands, so you can identify elements to improve the quality of your projects. This case study of the “Findings” feature shows how a good HMI design can help you to deal with this problem.
Source code violations overview
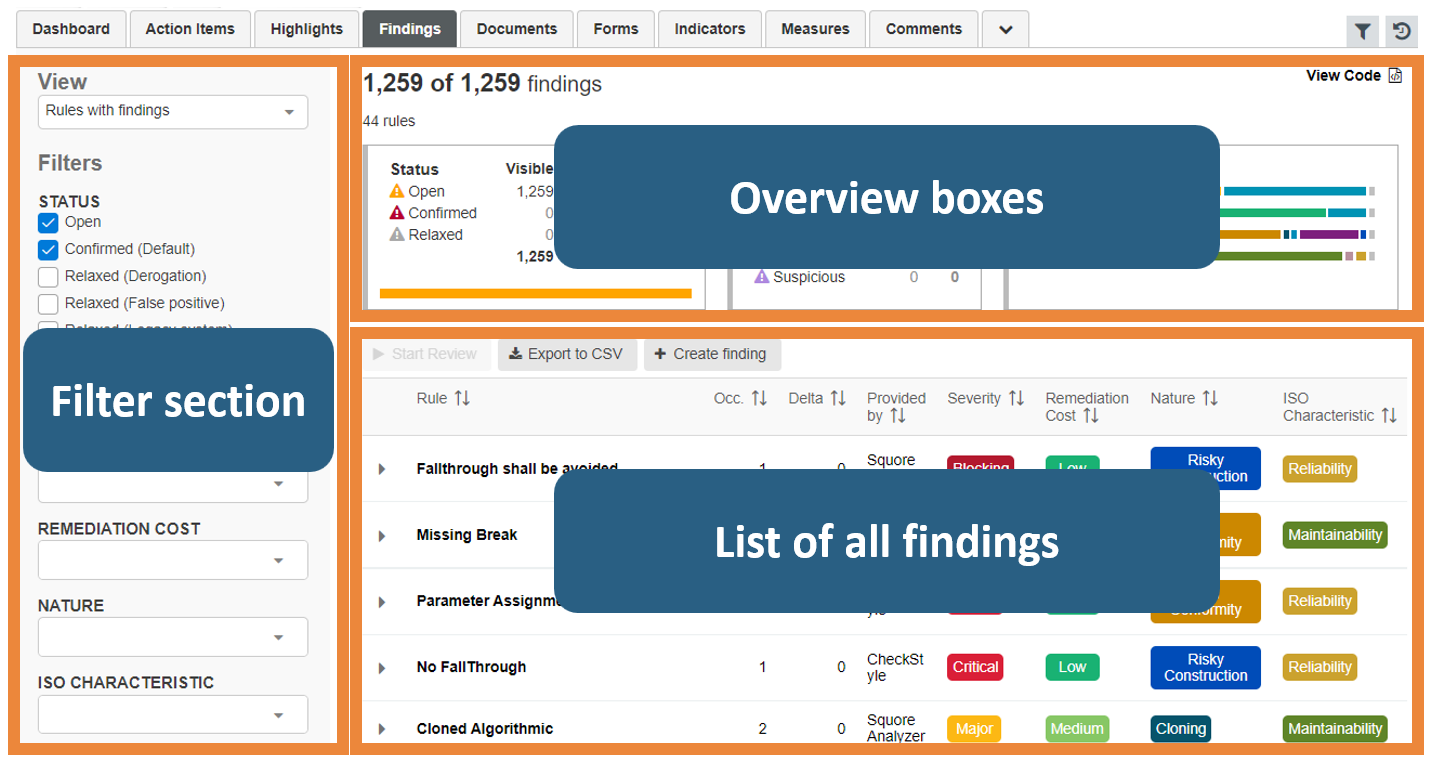
Figure 1 below presents the rule violations found in the source code as a “Findings” page. A table lists all the findings (Figure 2), overview boxes represent the distribution of the findings according to their characteristics (Figure 3) and a filter section allows you to display findings sharing certain criteria (Figure 4).
Relevant code violations: Findings design
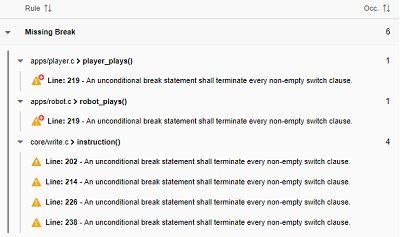
Three main characteristics define findings: the rule itself, the related artifact and the location. Usually, code violates the same rule several times and relates to the same artifact but at different locations. So, it is possible to group findings by artifacts and by rules. In figure 5 the code violates the rule “Missing Break” 6 times for 3 artifacts in different locations. Since the rule name is the main characteristic, findings are grouped by rules, then by artifacts (i.e. source code elements).
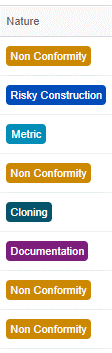
“Categories” for each rule help to sort them. For example, a rule can have a “Severity” or a “Remediation Cost” or an “ISO Characteristics” value.
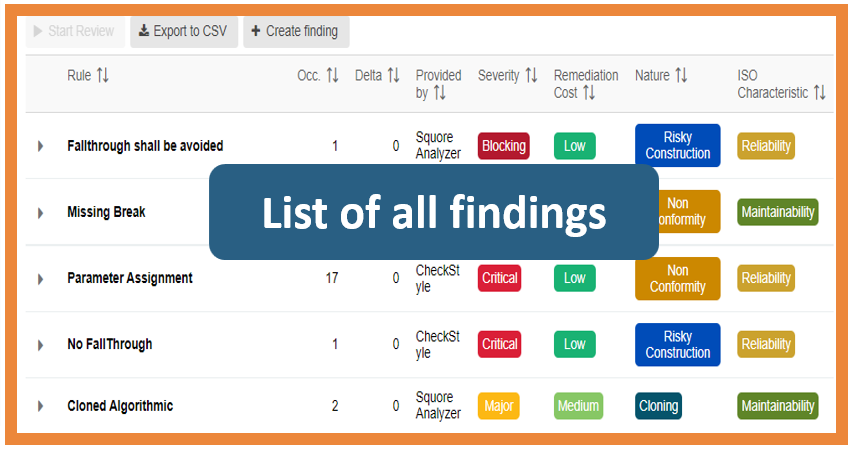
Badges represent the categories visually: a textual value, a color, and a width. This choice results from the application of the “Similarity” law of Gestalt theory [2]. It states that items that share the same visual characteristics are perceptually grouped more easily. Therefore, as shown in Figure 2, you will gather faster all rules whose violations belong to the same category “Remediation cost” because the badge design is similar to this rule, and different than all the others. You naturally can create different subsets of different rules.
Color-coding findings categories
 |  |
| Figure 6a – Scaled category | Figure 6b – Unscaled category |
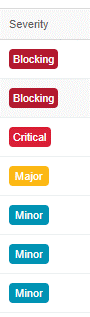
Since categories can be scaled according to a rank of values (Figure 6a), the Severity category is defined by a scale, from “Minus” to “Blocking”, with a central value “Medium”. The visual aspect of the badge is enough to help estimate the value thanks to a color gradient, from red (Blocking) to green (Minus). For non-scaled categories (Figure 6b), it is important that the badges are different from each other to avoid incorrect perceptual grouping.
The three visual dimensions (text, color, and width) allow you to group similar rules and evaluate scaled values.
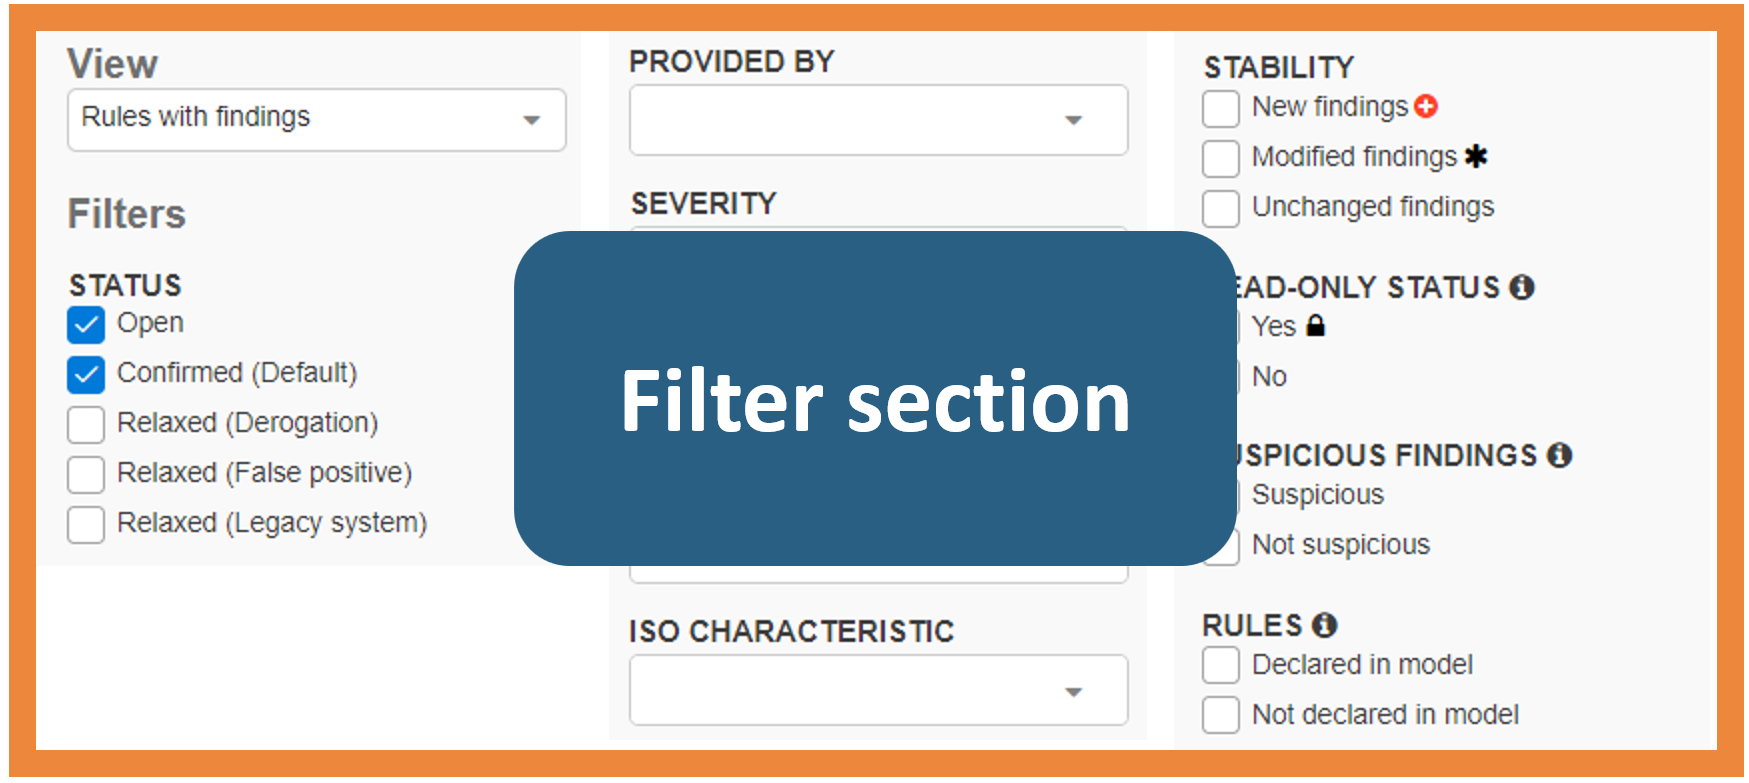
Filter relevant violations
Facing the large amount of information, it is essential for you to manage a subset of findings corresponding to custom criteria, in order to find relevant source code violations. It helps in reducing the scope of the review task, to quantify the number of violations according to some categories, or to display only the new findings that have been parsed during the last project analysis.
Among the possibilities of layout [3], it was decided to group all filters in a dedicated section for three reasons. First, considering a dozen filters, you need to check all the filters applied and their combinations in the same place. Then, the application of Fitts’ law [4], which determines the difficulty to interact with components depending on their distances and dimensions, confirmed the choice of this layout. Finally, grouping filters in the same section reduces the difficulty to interact with them. The left-position of the filters section enables a parallel reading between the filter selection and the result obtained.
In the end, filtering relevant source code violations can be greatly simplified by an appropriate layout and user interface logic.
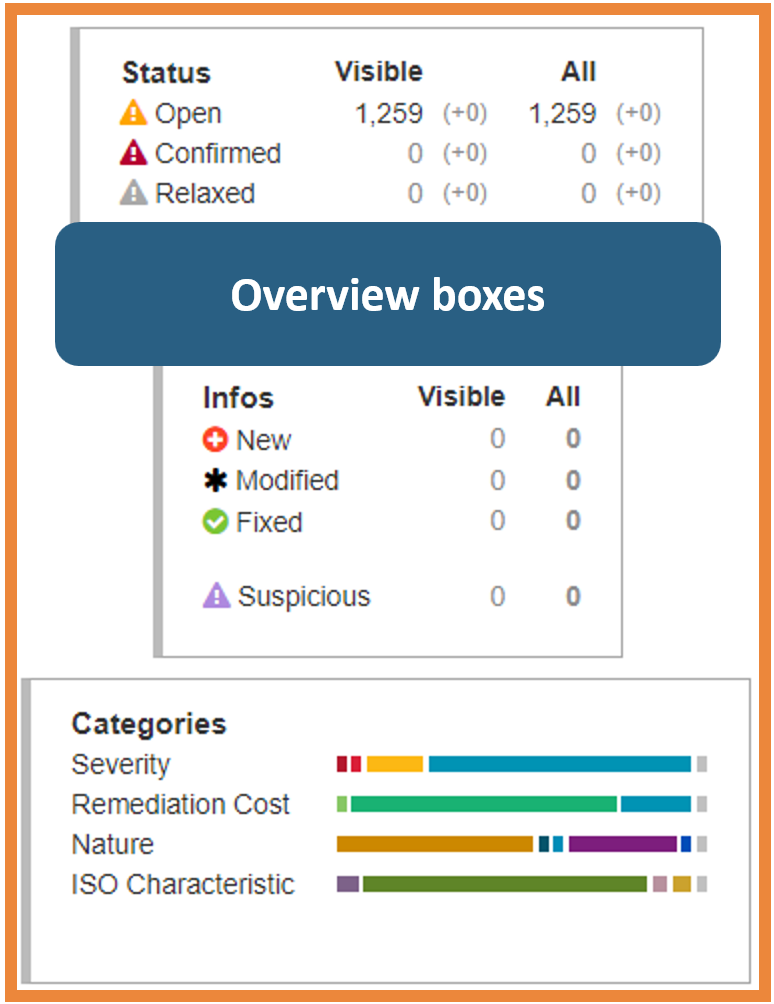
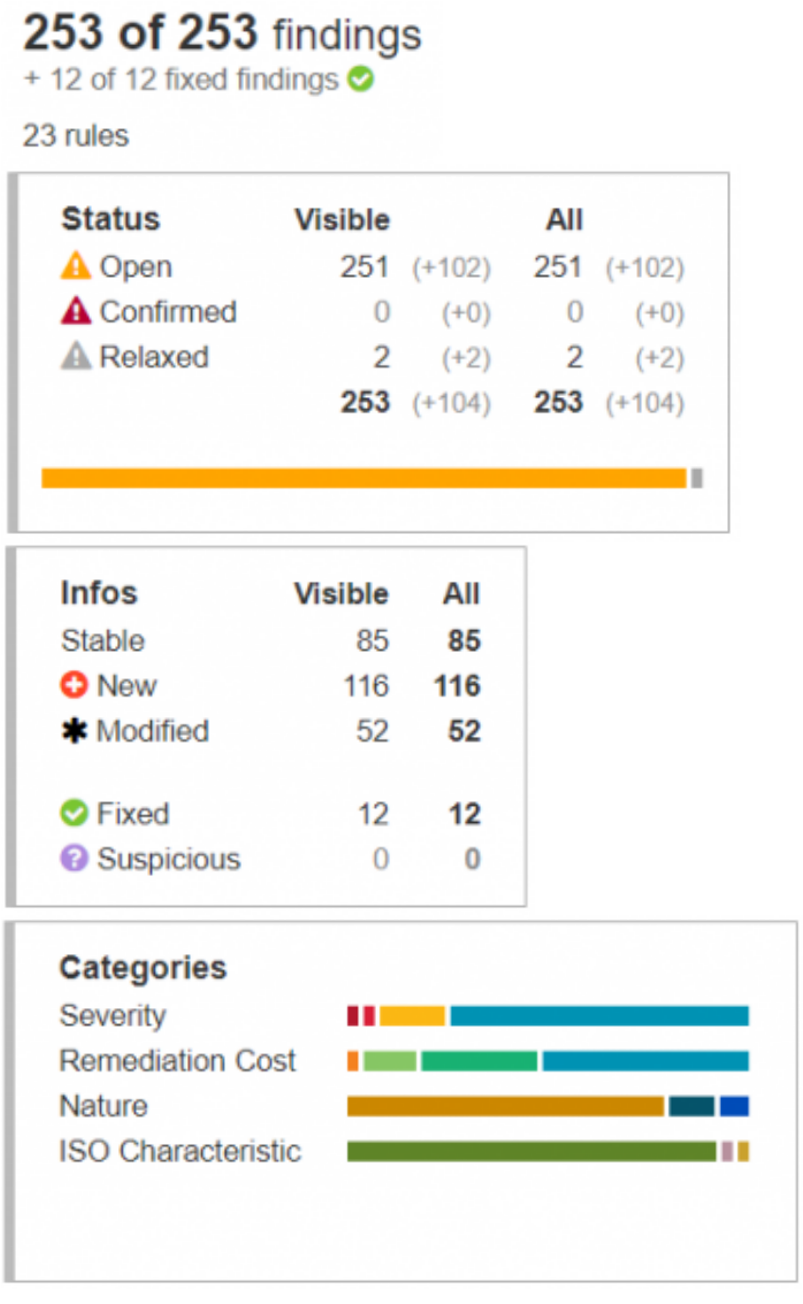
Overview Boxes
It is important to provide a way to have a simplified overview of all the findings. For this reason, three boxes summarize the distribution of findings according to their characteristics: statuses, information, and categories. The counting, divided into “Visible” and “Total” sections, allows you to have an overall view. They give information about the information displayed (“Visible”) and the overall state of the project (“Total”). Bar charts to help you to quickly visualize an estimation of the distribution of findings.
Go into the details and explore your source code
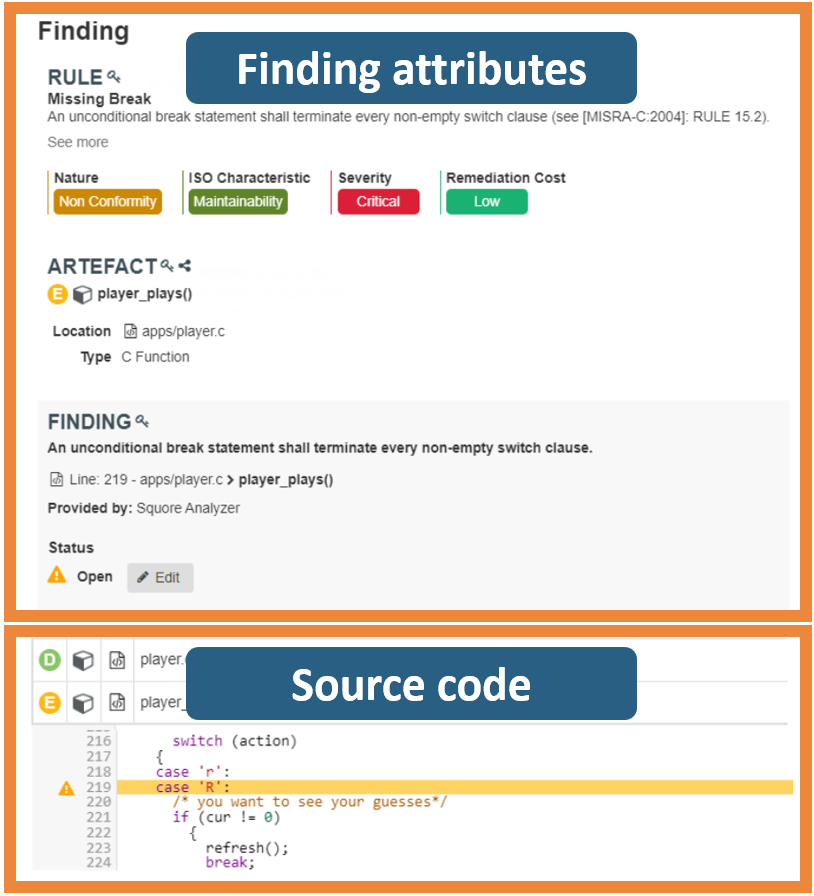
So far, we have only studied the overall view of the findings. The “Detailed View” displays the information related to findings individually along with the source code.
In the form of a lateral view, the “Detailed View” takes advantage of the property of keeping the current context. This property is important to not break your workflow when navigating through findings.
The structure of this view is based on the same structure of the grouping in the findings table. It ensures consistency between the views and reduces the effort to remember the structuration “Rule-Artifact-Location”.
In a source code context, the view exposes the source code associated with the artifact and highlights its location. You are then able to better understand the source code violation thanks to the general context and the previous and following statements.
Conclusion
This blog post presents the solution implemented to filter relevant violations in a source code context. It tried to respond to the constraints resulting from the huge quantity of information. The design choices relied on the theory and good practices established by the HMI discipline. Providing functionality that is both useful and usable helps you to improve the quality of your projects.
If you want to explore Squore findings by yourself, take a look at the Squore Showcase, where we analyze open source projects (example: the Keras project findings page)
References and further information
- Squore Showcase – Find out more about Squore in a practical example
- Squore product information: Analytics for projects monitoring
- Gestalt Theory
- Filters design
- Fitts’ Law